In this document
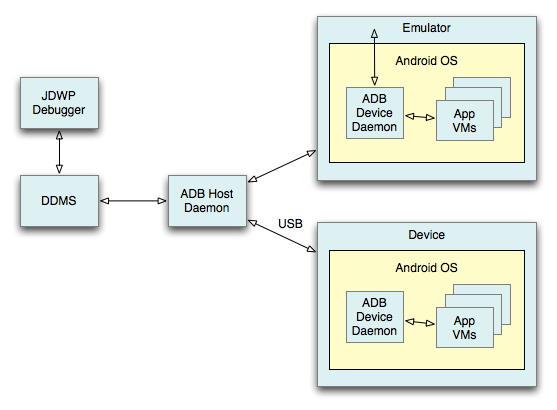
The Android SDK provides most of the tools that you need to debug your applications. You need a JDWP-compliant debugger if you want to be able to do things such as step through code, view variable values, and pause execution of an application. If you are using Android Studio, a JDWP-compliant debugger is already included and there is no setup required. If you are using another IDE, you can use the debugger that comes with it and attach the debugger to a special port so it can communicate with the application VMs on your devices. The main components that comprise a typical Android debugging environment are:
- adb
adbacts as a middleman between a device and your development system. It provides various device management capabilities, including moving and syncing files to the emulator, running a UNIX shell on the device or emulator, and providing a general means to communicate with connected emulators and devices.- Dalvik Debug Monitor Server
- DDMS is a graphical program that communicates with your devices through
adb. DDMS can capture screenshots, gather thread and stack information, spoof incoming calls and SMS messages, and has many other features. - Device or Android Virtual Device
- Your application must run in a device or in an AVD so that it can be debugged. An
adbdevice daemon runs on the device or emulator and provides a means for theadbhost daemon to communicate with the device or emulator. - JDWP debugger
- The Dalvik VM (Virtual Machine) supports the JDWP protocol to allow debuggers to attach to
a VM. Each application runs in a VM and exposes a unique port that you can attach a debugger to
via DDMS. If you want to debug multiple applications, attaching to each port might become
tedious, so DDMS provides a port forwarding feature that can forward a specific VM's debugging
port to port 8700. You can switch freely from application to application by highlighting it in the
Devices tab of DDMS. DDMS forwards the appropriate port to port 8700. Most modern Java IDEs include a JDWP debugger,
or you can use a command line debugger such as
jdb.
Debugging Environment
Figure 1 shows how the various debugging tools work together in a typical debugging environment.

In addition to the main debugging tools, the Android SDK provides additional tools to help you debug and profile your applications:
- Heirarchy Viewer and layoutopt
- Graphical programs that let you debug and profile user interfaces.
- Traceview
- A graphical viewer that displays trace file data for method calls and times saved by your application, which can help you profile the performance of your application.
- Dev Tools Android application
- The Dev Tools application included in the emulator system image exposes several settings that provide useful information such as CPU usage and frame rate. You can also transfer the application to a hardware device.
Debugging Tips
While debugging, keep these helpful tips in mind to help you figure out common problems with your applications:
- Dump the stack trace
- To obtain a stack dump from emulator, you can log
in with
adb shell, usepsto find the process you want, and thenkill -3. The stack trace appears in the log file. - Display useful info on the emulator screen
- The device can display useful information such as CPU usage or highlights around redrawn areas. Turn these features on and off in the developer settings window as described in Debugging with the Dev Tools App.
- Get application and system state information from the emulator
- You can access dumpstate information from the
adb shellcommands. See dumpsys and dumpstate on the adb topic page. - Get wireless connectivity information
- You can get information about wireless connectivity using DDMS. From the Device menu, select Dump radio state.
- Log trace data
- You can log method calls and other tracing data in an activity by calling
startMethodTracing(). See Profiling with Traceview and dmtracedump for details. - Log radio data
- By default, radio information is not logged to the system (it is a lot of
data). However, you can enable radio logging using the following commands:
adb shell
logcat -b radio
- Capture screenshots
- The Dalvik Debug Monitor Server (DDMS) can capture screenshots from the emulator. Select Device > Screen capture.
- Use debugging helper classes
- Android provides debug helper classes such as
util.LogandDebugfor your convenience. - Garbage collection
-
The debugger and garbage collector are currently loosely integrated. The VM guarantees that any
object the debugger is aware of is not garbage collected until after the debugger disconnects.
This can result in a buildup of objects over time while the debugger is connected. For example,
if the debugger sees a running thread, the associated
Threadobject is not garbage collected even after the thread terminates.