Tracer is a tool for analyzing OpenGL for Embedded Systems (ES) code in your Android application. The tool allows you to capture OpenGL ES commands and frame by frame images to help you understand how your graphics commands are being executed.
Note: The Tracer tool requires a device running Android 4.1 (API Level 16) or higher.
Running Tracer
Tracer can be run as part of the Eclipse Android Development Tools (ADT) plugin or as part of the Device Monitor tool.
To run Tracer in Eclipse:
- Start Eclipse and open a workspace that contains an Android project.
- Activate the perspective for Tracer by choosing Window > Open Perspective > Other...
- Select Tracer for OpenGL ES and click OK.
To run Tracer in Device Monitor:
- Start the Device Monitor tool.
- Activate the perspective for Tracer by choosing Window > Open Perspective...
- Select Tracer for OpenGL ES and click OK.
Generating a Trace
Tracer captures OpenGL ES command execution logs and can also capture progressive images of the
frames generated by those commands to enable you to perform logical and visual analysis of your
OpenGL ES code. The Tracer tool operates by connecting to a device running Android 4.1 (API Level
16) or higher that is running the application you want to analyze. The Tracer tool captures trace
information while the application is running and saves it to a .gltrace file for
analysis.
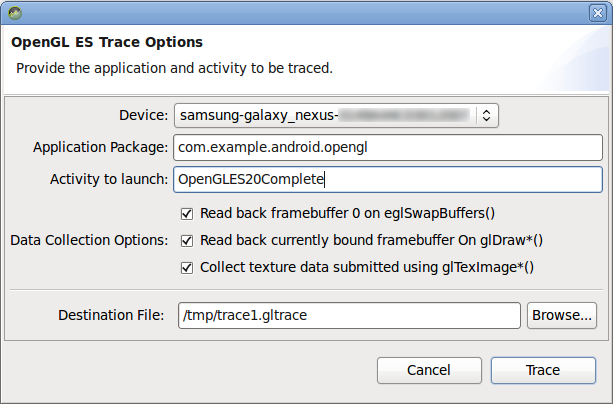
Figure 1. Trace capture dialog box.
To capture an OpenGL ES trace for an Android application:
- Connect the Android device using a USB cable and make sure it is enabled for debugging. For more information, see Using Hardware Devices.
- In Eclipse or Device Monitor, activate the Tracer for OpenGL ES perspective.
- On the toolbar, click the trace capture button (
 ).
). - In the dialog box, select the Device to use for the trace.
- In the Application Package field, enter the full application package name
containing the activity you want to trace, for example:
com.example.android.opengl - In the Activity to launch field, enter the class name of the activity you
want to trace, for example:
OpenGLES20CompleteNote: If you are tracing the default activity for the application, you can leave this field blank.
- Select the desired Data Collection Options.
Note: If you want to capture progressive frame images for each drawing call, enable the Read back currently bound framebuffer on glDraw*() option. Be aware that using this option can result in large trace files.
- Enter a Destination File for the trace output.
- Click Trace to start the trace capture.
- On the connected device, exercise the functions of your application you want to trace.
- In the dialog box, Stop Tracing to complete the tracing run.
Analyzing a Trace
After you have generated a trace, you can load it for review and analysis.
To review a captured trace:
- In Eclipse or Device Monitor, activate the Tracer for OpenGL ES perspective.
- On the toolbar, click the trace load button (
 ).
). - After loading a trace, select a frame and review the OpenGL ES calls. Drawing commands are highlighted in blue.